Simulator
The Order Grid Trading Simulator is a special tool to simulate trading based on historical trade price data. The simulator allows you to test the following grid parameters:
- Start point
- Grid line width
- Grid coverage (number of grid lines).
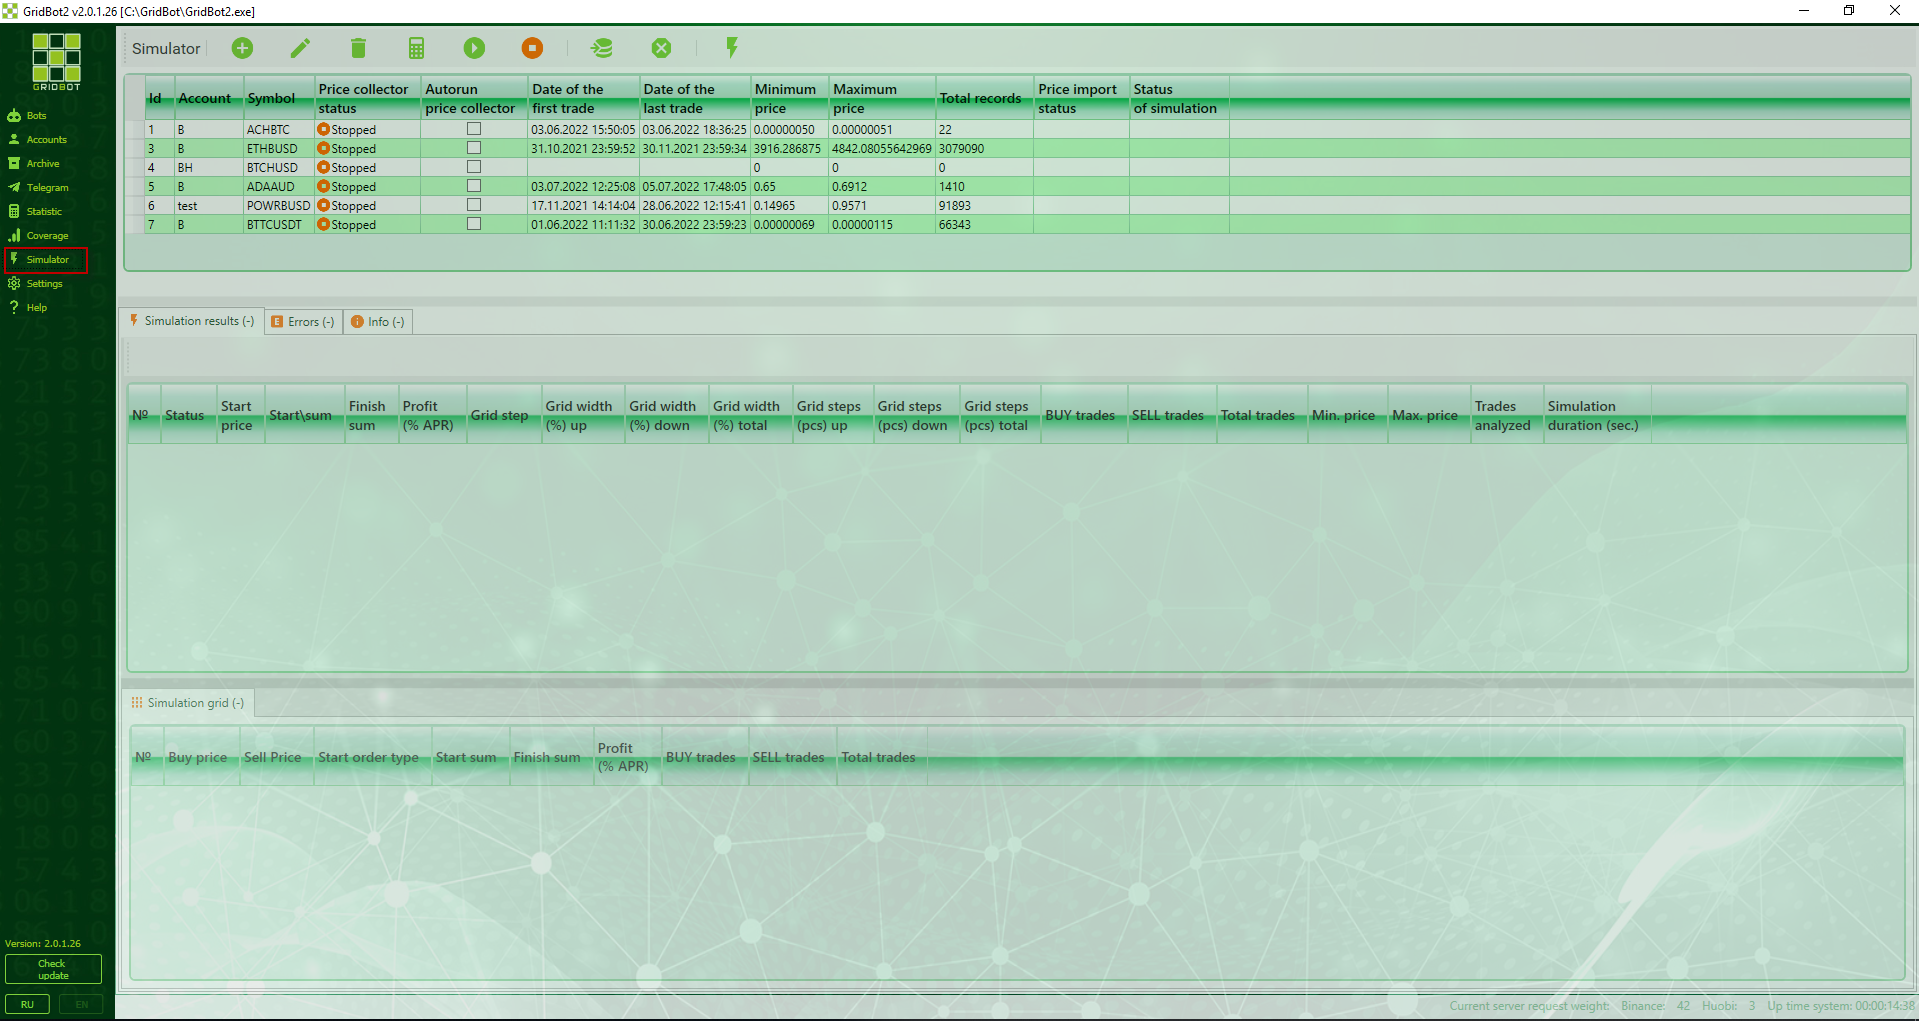
The simulator window consists of 3 parts:
- Simulators list
- Simulation results, which contains a list of simulations that have been executed. The list of errors and information messages is displayed on separate tabs.
- Simulation grid with statistics and grid line parameters
List of simulators
Consider the part of the window with the list of simulators:
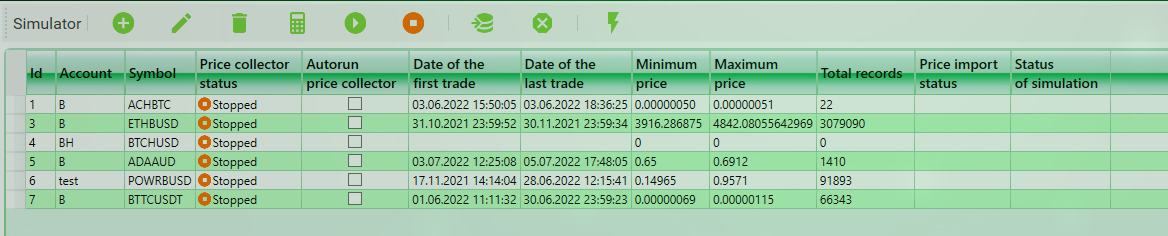
Column composition:
- "Code" - the number of the simulator in the database
- "Account" - account, through which the data on prices are received from the exchange
- "Symbol" - the symbol for the simulation
- "Price collector status" - the current state in which the price collector of the simulator is. For more information about the price collector, see the appropriate section. It can be:
- "Stopped" - the price gatherer is stopped
- "Stopping" - the price collector is stopping now.
- "Collecting prices" - the prices are collecting
- "Autorun price collection" - sign of the necessity to automatically start the price collector for the simulator when you start the program.
- "Date of first trade" - date and time of the earliest trade saved in the database for the simulator
- "Last trade trade" - date and time of the latest trade saved in the database for the simulator
- "Minimal price" - value of the lowest price of the trade stored in the database for the simulator
- "Maximum price" - value of the maximum price of the trade stored in the database for the simulator
- "Total records" - total count of records with prices of deals in the database for the simulator
- "Price import status" - current status of the price import procedure. Can be:
- Empty, if the import has not been started
- "Import in progress..." - if the import of prices is being done at the moment
- "Import completed" - if the data import is finished
- "Simulation status" - the current status of the simulation. It can be:
- Empty, if the simulation has not started
- "Simulation running" - if the simulation is running at the moment
- "Simulation successfully finished" - if the simulation is finished without errors
- "Simulation completed with error" - if the simulation is finished and an error has occurred. The text of the error can be seen in the "Errors" tab of the middle part of the window.
 - Add new simulator
 - Change the selected simulator
 - Delete the selected simulator. When deleting, all prices of this simulator will be deleted.
 - Recalculate the statistics for all simulators.
 - Start the price collector of the selected simulator
 - Stop the price collector of the selected simulator
 - Import prices into the selected simulator. For more information about importing prices, see the relevant section
 - Clear the prices of the selected simulator. All saved prices of the selected simulator are deleted.
 - Run the order grid trading simulation for the selected simulator.
Adding and changing a simulator
When adding or changing a simulator, you must fill in the fields in the window: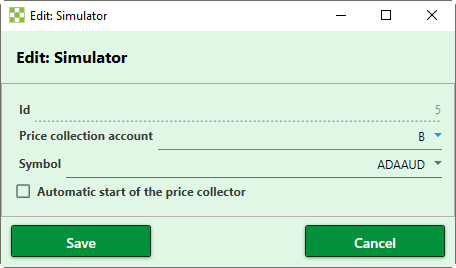
- Id- number of the simulator. Filled in automatically when saving.
- Account for price collection - account from the list of accounts, through which prices are received
- Trade pair - trade pair for which price collection, import and simulation will be performed.
- Automatic start of the price collector - the sign of the necessity to automatically start the price collector when you start the program. Immediately after creating the simulator it is necessary to start it manually using the appropriate button.
Price Collector
After each saving of the collected prices to the database (every 30 seconds) the statistics is recalculated. The price collector collects only current prices of trades at the exchange the history of prices is not loaded, the exchange provides historical data on deals only in the collapsed form. If for some time the price collector was not working, then there will be a gap in prices, which is not considered in the simulation - as if there was no gap, but there is a big time lag between deals. For more accurate simulation, it is necessary for the time series of prices to have as few gaps as possible.
Prices are saved to a separate database, which is located in the same directory as the GridBot2.exe application executable file and is called Prices.db. The format of the database is SQLite. Note that the Prices database can be very large, so make sure that the application directory is located on a disk with sufficient free space. When you clear the price data of the selected simulator or delete a simulator, the size of the database is automatically reduced by the deleted amount of data.
It is possible to simultaneously collect prices for any number of trading pairs. Restrictions can be only on the part of an exchange. Rules and restrictions of exchanges are regularly updated.
Import prices
Simulation of trading using a grid of orders
To start the simulation, press the button ![]() , the following window will open:
, the following window will open: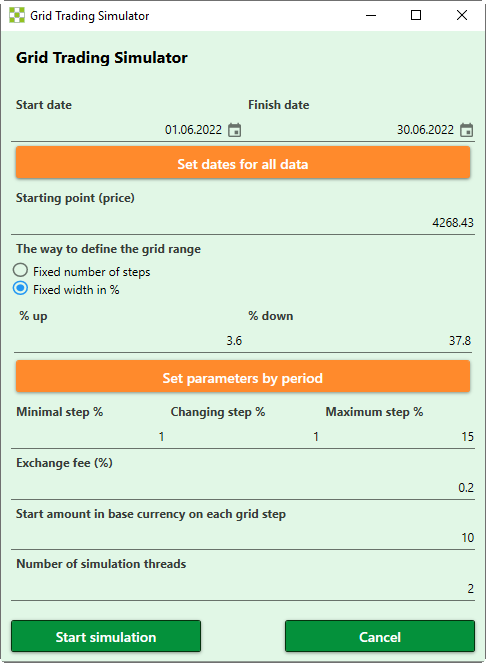
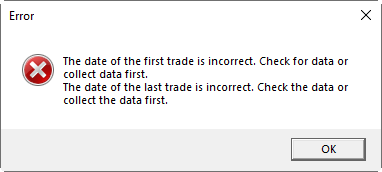
- "Start Date" and " Finish Date" of the data period of interest. For this period the data from the database on prices will be extracted. When you click the "Set dates for all data" button, the dates of the earliest trade in the start date and the latest in the end date will be set. If there is no data in the price database, the following error message will be displayed:
- "Starting point (price)" - the price from which the grid will be built up and down. You may set by default using the button "Set parameters by period" as the price of the earliest transaction in the specified period.
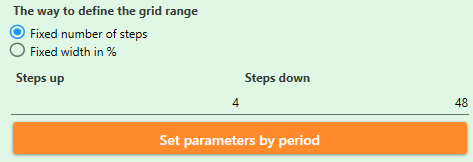
- "The way of defining the grid range" - two options are possible:
- "Fixed number of steps" - specifies the number of grid steps up and down from the starting point. You can set it by default with the "Set parameters by period" button as a number of steps covered by the smallest grid step from the starting point to the maximum and minimum price.
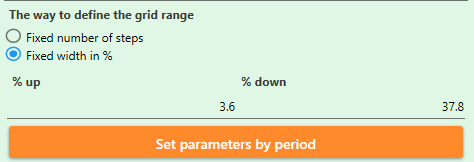
- "Fixed width in %" - the width of the upper part of the grid and the lower part from the starting point is specified. You may set by default using the "Set parameters by period" button as percentages covering price changes from the starting point to the maximum and minimum price.
- "Fixed number of steps" - specifies the number of grid steps up and down from the starting point. You can set it by default with the "Set parameters by period" button as a number of steps covered by the smallest grid step from the starting point to the maximum and minimum price.
- The grid step is in % which is sequentially going from the minimum to the maximum with the specified change. Thus, the simulation will enumerate the corresponding number of grid variants, for example:
- For parameters 1/1/10 there will be 10 simulations with steps 1,2,3,4,5,6,7,8,9,10 percent
- For the parameters 1/0.5/10 there will be 19 simulations with steps 1,1.5,2,2.5,3,3.5,4,4.5,5,5.5,6,6.5,7,7.5,8,8.5,9,9.5,10 percent.
- "Exchange fee" - the amount of fee, which is charged by the exchange when making a trade.
- "Start amount in base currency for each step of the grid" - the number of coins in the base currency of the trading pair, which is allocated to the start orders in the simulation. This parameter affects only the absolute value of profit, it has no effect on % per annum.
- "Number of simulation threads" - the number of parallel threads, in which the simulation will be processed. The number of threads is indicated per simulation, so if you run the simulation on several simulators simultaneously, the number of threads will be increased by a multiple of the number of simultaneous simulations.
After the start of the simulation, you must wait until the end - the status of the simulation becomes "Simulation successfully finished ".
The middle part of the window displays all simulations that have been run:
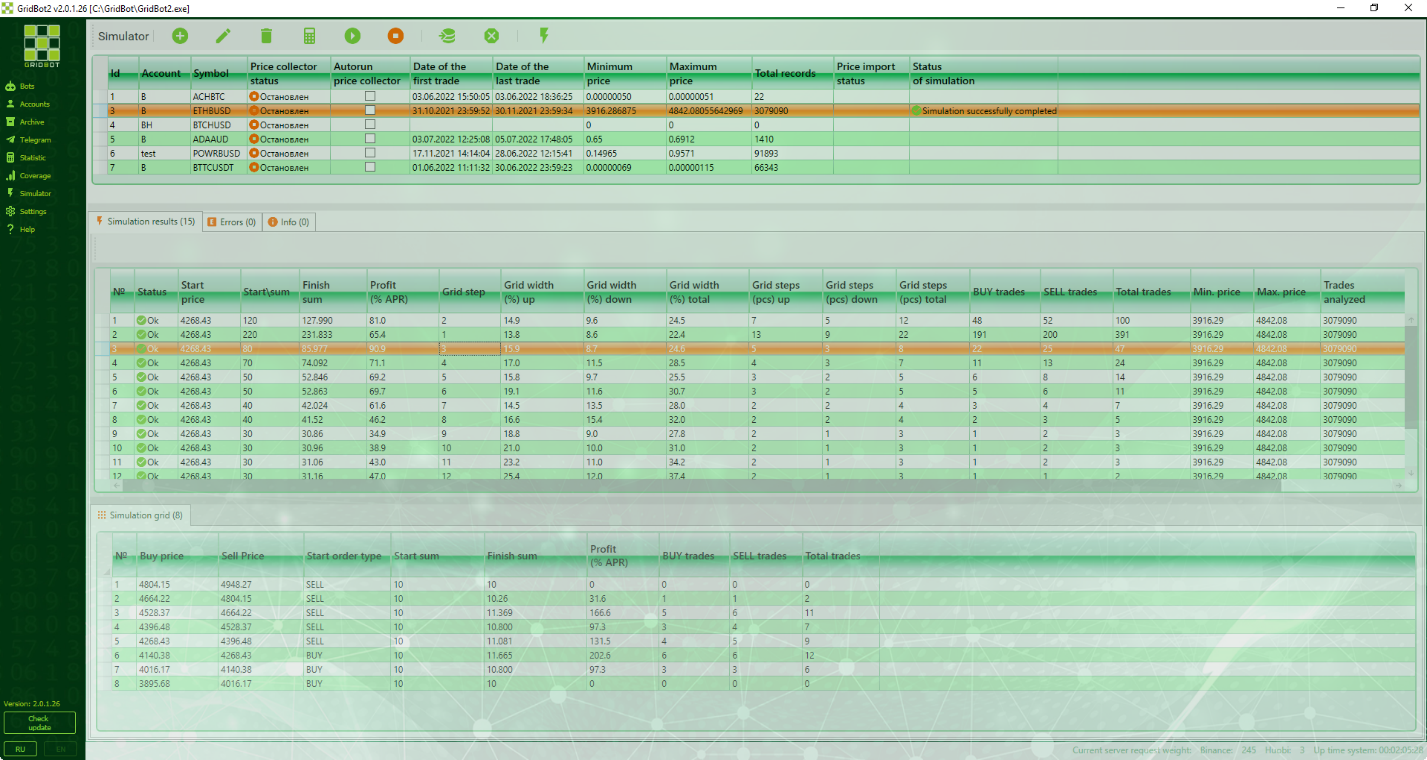
Column composition of the middle part of the window:
- "No." - sequence number of the simulation
- "Status" - status of the simulation
- "Start point" - price, from which the grid of orders was built up and down
- "Amount at start" - total amount at the start on all lines of the grid
- "Finish sum" - total sum on all lines of the grid at the end of the simulation
- "Profit (% per annum)" - total annual percentage of the simulation
- "Step of grid" - step of the grid in percent of the price
- "Grid width (%) up" - the upper part of the grid in % from the starting point to the upper line of the grid
- "Grid width (%) down" - lower part of the grid in % from the starting point to the lower line
- "Grid width (%) total" - total width of the grid in %
- "Grid steps (pieces) up" - number of grid lines up from the starting point
- Grid steps (pieces) down" - number of grid lines down from the starting point
- Grid steps (pieces) total" - total amount of grid lines
- "BUY deals" - total amount of deals for buying on all grid lines
- "SELL deals on sale" - total deals on sale by all grid lines
- "Total trades" - total number of deals
- "Min. price" - minimum price from all trades in the simulation
- "Max Price" - the maximal price of all simulation deals
- "Trades analyzed" - the amount of trades the simulation was performed on
- "Simulation duration (sec)". - Total time spent on the calculations. It doesn't include the time for sampling and data preparation.
The bottom part of the window shows the statistics of the grid the simulation was performed on. It is necessary to select the simulation of interest in the middle window to display its grid.
The composition of the columns of the grid statistics, is as follows:
- "No." - grid row number
- "Buy price" - price, at which BUY orders are placed on the gridlines
- "Sell price" - price, at which SELL orders are placed on the grid line
- "Start order type" - type of the start order on the grid line
- "Amount at start" - the amount of the starting order on the grid line
- "Finish sum" - the sum of the order on the finish line of the grid
- "Profit (% per annum)" - total annual percentage of simulation on the grid line
- "BUY trades" - total buy trades on the grid line
- "SELL deals" - total trades for selling on the grid line
- "Total trades" - total amount of deals on the grid line
Features of the simulation algorithm
- The simulation uses a simplified calculation model, which does not greatly affect the accuracy, but greatly speeds up the calculation, and also does not require data on the rates of other trading pairs, which are used to calculate the profit given to BTC and USDT of each of the coins of the trading pair when trading. It also simplifies the indication of the starting amount on the grid lines - everywhere the same amount and expressed only in the base currency, although the lower part of the grid will be put to buy and need to possess the second currency of the pair. At the same time profit is calculated for a pair of SELL-BUY or BUY-SELL trades as the accumulated sum plus % of the step width and minus double commission percentage, as the fee is paid for both trades of the pair.
- Trading volumes are not taken into account to simplify and speed up calculation. It is conditionally assumed that if an order is executed, it is always executed for the full amount.
- The result of the simulation is given by the period to the % per annum, so that it would be possible to compare different pairs and different data periods. At the same time for the simulation period is taken the specified "Start Date" and "Finish Date", which can be wider than the available trades. Gaps on trades are considered as idle time, respectively the calculated % per annum will be less. For example, if we have collected data for the month of May, but in our simulator we have specified two months - May and June, the trades, in fact, were performed only in May and that is why the calculated % will be twice less than if we run the simulation only for May. It should be taken into account.
- When trading, the results are capitalized after each pair of trades
Resource Requirement
It should be taken into account that in the simulation, all of the data on prices is selected in the RAM. With a large number of deals, the use of memory can be significant - tens of GB. In order to reduce memory consumption, it is necessary:
- Reduce the number of simultaneous simulations for different trading pairs.
- Reduce the period of price selection
The number of threads does not significantly affect memory consumption.
It is not recommended to indicate the number of threads greater than the number of logical threads supported by your CPU. It can lead to slowdown of your computer.
Interpreting the result
It is important to understand how to interpret and use the result of the simulation. The following theses can be highlighted:
- All results are probabilistic. There is no 100% probability that the result will be repeated.
- Simulation is based on past data and there is no guarantee that in the future there will be similar trading volumes and volatility of the selected trading pair.
- The result of simulation is approximate and gives you the understanding of the level of profitability, if you started trading with simulated grid parameters.
- The size of the data you analyze is very important. If you do the simulation on 7 days - the probability of repeating the result is less than if you do it on 30 days.
- If you are satisfied with the results of the simulation for some symbol, and you want to try trading with the same parameters, then make a test bot with minimal orders on each line of the grid (usually ~ 10 USDT) and analyze it during about 1/4 of the simulation period (if the simulation is for 1 month, then you should observe it for at least 1 week) and correct the bot parameters or close it, if you are not satisfied with the result.